


How do you approach market sizing? Recently, I’ve been asked by several clients to help with sizing their potential market in the financial services vertical in order to raise capital or position their companies for acquisition.
Most entrepreneurs approach this from a top down perspective. They start by defining the total addressable market, then they narrow it to the served available market, and they narrow from their to identify their target market.
Example of Top Down Market Sizing
For example, in 2004, my partner and I raised $6M in venture capital for a firm we co-founded. We took a top-down approach to market sizing. Our company offered an enterprise application integration (EAI) and order routing platform for the financial services industry.
Total Addressable Market Size
To do our sizing, I found analyst reports that estimated the overall size of IT budgets for enterprise integration efforts. Note the vast variations in their numbers in the slide below. (In case you’re wondering, here’s a definition of total addressable market).
- IDC said the industry was $5B in 2001 and projected $21B in 2005
- Wintergreen projected $2B in 2001, growing to $7B in 2005.
Serviceable Addressable Market
Then we used another analyst firm’s estimate of the percentage of IT budgets spent on integration. Gartner estimated that 40-50% of IT budgets were being invested in integration projects. So we used that to calculate the market opportunity.
Our firm was focused exclusively on the financial services industry. So we used yet another analyst’s estimate of the financial services industry’s total share of the integration market. Here, I found a report from Tower Group claiming that financial services accounts for 60% of the EAI market.
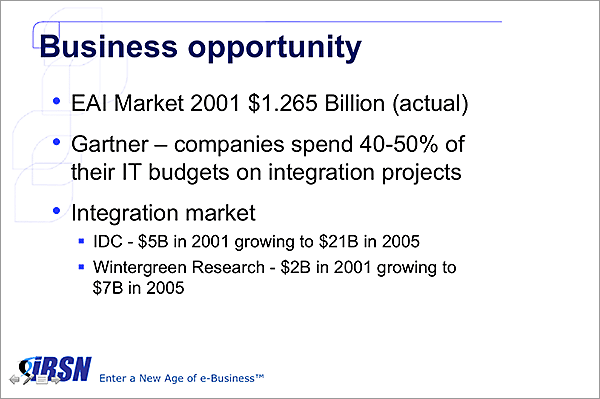
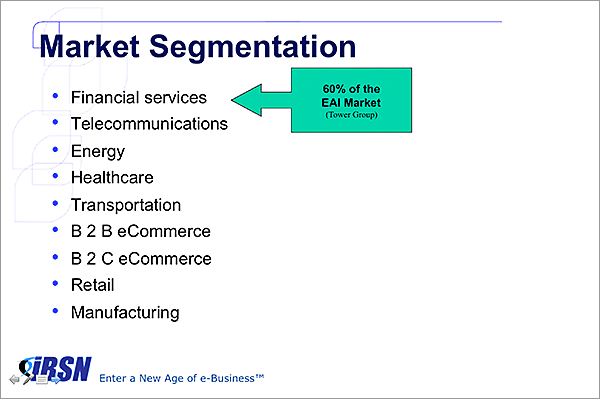
Even though we had no intention of chasing the total financial services industry, this is the number we used for our potential market size. We estimated the market to be worth $1.265B in 2001.
We intended to focus on a tight niche within the financial services industry, and we spelled that out in our plans. However, we didn’t have the resources to dig deeper and analyze the true scope of our actual target market.
Served Available Market for a Financial Services Niche
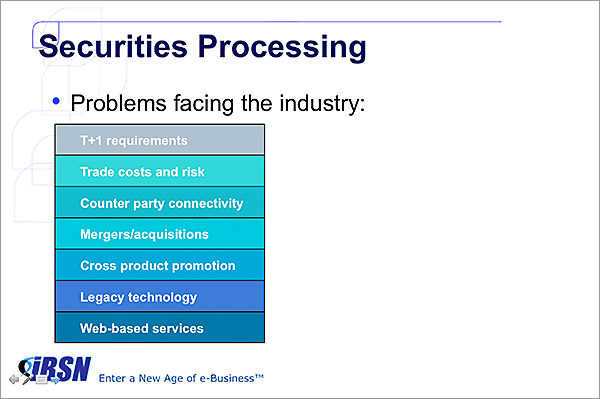
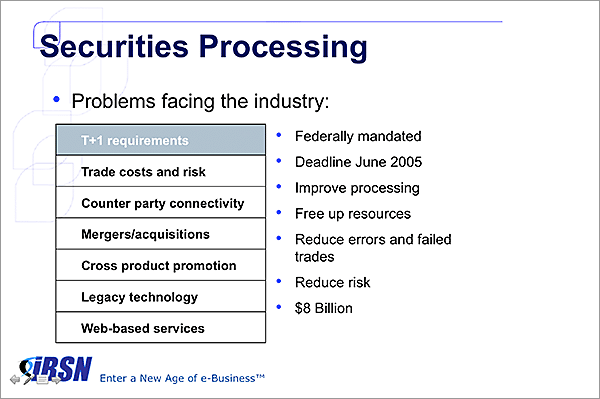
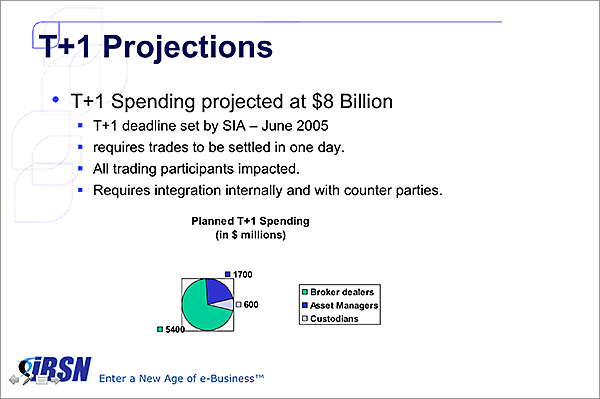
So I took another approach for sizing our niche. We identified 7 key problems facing the securities processing niche, and we broke each of these down into specific needs. At the time, it looked like the industry was going to be required to move to T+1 trade settlement, which would shorten the time the industry takes to settle trades from 3 days down to 1 day. This would have had a massive impact on the industry and represented a huge opportunity for vendors. So we focused on that.
Target Market for Specific Use Cases
I found a report that estimated the total spending globally by the industry segments we were chasing. This gave us a completely different market size estimate, but was a bit easier to defend than our other approach.

It Worked…I Think…
This approach worked for our capital raise in 2004…sort of. Actually, I’m assuming that the investors deeply discounted and probably completely ignored these numbers, because they were so outrageously high and because the sources were so unrelated to each other. In addition, those requirements for T+1 never came to pass. Many firms went ahead with the changes needed to shorten settlement timeframes, but the industry as a whole is still at a T+3 settlement cycle today, 13 years later. I still occasionally see a regulatory push toward T+1, and maybe it really will happen eventually. But I wouldn’t bet a business on it. So if our investors were wise, they saw through our market sizing baloney and invested for other reasons, not because they believed our market opportunity was that large.
If you’re planning to take a top down approach, here’s a free total addressable market template and evaluation model
Bottom Up Approach to Market Sizing
At the time, our business was new enough that we didn’t have a lot of insight to regarding how much clients would pay for our systems. So we had little choice but to do a top-down analysis. It’s still the right approach for a business just getting started, but I’d recommend being a bit more rigorous with your analysis.
Two of my clients who are currently working on market sizing are larger, more established businesses with a healthy track record. So I’m advising them to take a bottom-up approach. Here’s how we’re approaching market sizing with these clients:
Identify the Total Addressable Market
These clients target the buy-side, so we tracked down lists of all asset managers, insurers, brokerages, clearing houses and other niches that would possibly have a need for their products.
Narrow Your Niche for the Total Serviceable Market
We defined the precise criteria that we’ve found qualifies a sales opportunity. For example, revenue, AUM, and employee count are relevant, as is the scope of services the account offers.
Identify Your Target Market
We then broke down the industry by niche, size, and AUM and dropped the companies that don’t meet the criteria we use to qualify accounts. This left us with our target market. We broke this down further to create categories based on company size and market niche. These categories became our market segments.
Calculate the Revenue Potential
We looked at our existing clients and broke them out by the market segments. Then we looked up the total revenue we’ve generated in the past couple years from each client in a given segment. Next, we analyzed our penetration and coverage within those accounts, so we could figure out our unrealized revenue potential, which we added to the actual revenue. Finally, we calculated an average total revenue potential for a client in a segment and multiplied that by the number of companies in that segment. We used that number for the market potential of a segment.
Calculate Your Target Market Opportunity
Then we took the potential revenue by segment and multiplied it by the number of total accounts in the addressable market for that segment. Add it up, and we have a very realistic estimate of our total target market opportunity…one that’s defensible and can be used for a real marketing and sales plan.
Is That Bottom Up Number Big Enough?
When we started these projects, our clients worried that the number we’d arrive at would be too small. But it actually ended up being an order of magnitude bigger than we anticipated. This approach gives us all the confidence that the business has a solid target market and that there is sufficient opportunity to justify an investment.
Frankly, if the number is not big enough taking this approach, then you probably don’t have a viable business anyway, so you probably need to go back to the drawing board.
How do you approach market sizing? Please email me with your approach, and I’ll aggregate responses in a future blog post.
For More Information
Below are some articles and podcasts that will help you dive deeper into your go-to-market strategy. If you’d like to discuss your particular case, feel free to contact me.
A Focused Target Market Delivers Outsized Results with Rick Carlson – Episode 007
An Ideal Customer Profile with Craig Rosenberg – Episode 002
![]()
- 4 Steps to Optimize Your LinkedIn Profile for Sales Prospecting – February 12, 2021
- The Reality of Cold Calling for B2B Sales – January 11, 2021
- Can Inbound Marketing Generate Enough Leads? – January 9, 2021


